Statistics from differents sources are merged in the report hereafter, about IPOL usage between 2010/09 and 2011/08. Like all web statistics, there are some approximations, but they can give an order of magnitude. Of course, algorithms and demonstrations on-line since more than one year ago are more likely to get good numbers. The demo pages are very partially included in these numbers.
Visits
During this year, www.ipol.im received 75.000 visits (200 visits/day). This is 4 times the number of visits received in 2009. Half of the visits came from returning visitors. One third of the visits were long visits, with more than one page read (demo pages not counted).
30% of the visits came from USA, 14% from France, 11% from China, 5% from Germany, 3% from Russia, then Spain, Japan, Taiwan, UK, Italy, India, Brazil, Korea, Belgium, Switzerland, ...
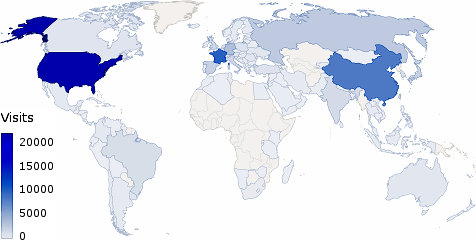
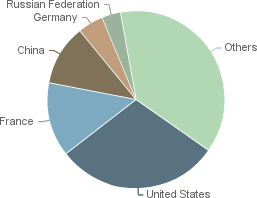
Provenance
A list of more than 850 science, research and education institutions could be recognized in the network provenance of the IPOL visitors. There probably are some duplicate denominations, and some locations count for hundreds of visits while some others only generated one page view, but this list shows the visibility of IPOL in the research community.
Some visitors also came from prominent companies of the internet, media, graphics, electronics and publishing sector.
Algorithms and Downloads
The top 10 viewed algorithm pages were
- 22.000
my_affine_sift - 12.000
gjmr_line_segment_detector - 10.000
bcm_non_local_means_denoising - 8.000
ags_algebraic_lens_distortion_estimation - 5.500
lmps_retinex_poisson_equation - 5.000
blmv_nonlinear_cartoon_texture_decomposition - 5.000
lmps_simplest_color_balance - 2.500
abmh_real_time_morphological_snakes_algorithm - 2.500
m_quasi_euclidean_epipolar_rectification - 2.500
g_image_interpolation_with_contour_stencils
4700 downloads (source code, programs and datasets) from IPOL were counted during this year. The top 10 files for unique downloads are
- 400
my_affine_sift/demo_ASIFT_src.zip - 300
my_affine_sift/demo_ASIFT_Win.zip - 220
gjmr_line_segment_detector/lsd-1.5.zip - 200
bcm_non_local_means_denoising/nlmeansB.tar.gz - 200
my_affine_sift/demo_ASIFT_src.tar.gz - 130
ags_algebraic_lens_distortion_estimation/src.zip - 100
my_affine_sift/dataset_Morel_Yu_09.zip - 80
bcm_non_local_means_denoising/src.zip - 80
lmps_retinex_poisson_equation/retinex_pde.tar.gz - 70
ys_dct_denoising/src_demoDCTdenoising.tar.gz
Demos
12000 experiences were performed on the demos with original images. The top 10 archives with new data during this year are
- 4.300
my_affine_sift - 2.200
gjmr_line_segment_detector - 1.400
bcm_non_local_means_denoising - 900
lmps_retinex_poisson_equation - 700
ggm_random_phase_texture_synthesis - 700
blmv_nonlinear_cartoon_texture_decomposition - 600
lmps_simplest_color_balance - 150
g_tv_denoising - 150
g_image_interpolation_with_contour_stencils - 150
g_interpolation_geometric_contour_stencils
We now (september 2011) have about 100 demo executions per day, including 50 with original data.
Settings
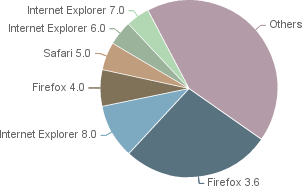
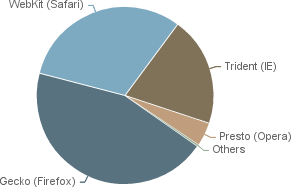
The dominant browser families are:
- 44% Firefox
- 31% Chrome/Safari
- 20% Internet Explorer
94% of the browsers have Flash, 81% have a Java plug-in.
The main operating systems of our visitors are:
- 33% Windows XP
- 31% Windows 7
- 16% Linux
- 11% Mac OS


